
Windows to the Universe Image Galleries
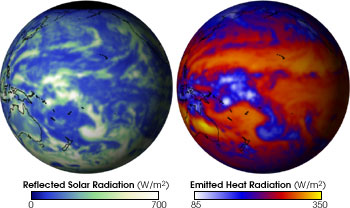
Earth - Climate - Climate Visualizations and Graphs


What's New on the Site?
When Nature Strikes - Earthquakes
When Nature Strikes - Volcanoes
When Nature Strikes: Tsunami Classroom Activity
When Nature Strikes: Wildfires - Why are they a challenge to stop?
Windows to the Universe Community | |
News | Opportunities |
Please log in
Science Blogs
Real Climate: climate science from climate scientists

Windows to the Universe, a project of the National Earth Science Teachers Association, is sponsored in part is sponsored in part through grants from federal agencies (NASA and NOAA), and partnerships with affiliated organizations, including the American Geophysical Union, the Howard Hughes Medical Institute, the Earth System Information Partnership, the American Meteorological Society, the National Center for Science Education, and TERC. The American Geophysical Union and the American Geosciences Institute are Windows to the Universe Founding Partners. NESTA welcomes new Institutional Affiliates in support of our ongoing programs, as well as collaborations on new projects. Contact NESTA for more information.
